Scientists release new interactive map of all 2.75 billion buildings on Earth including your home
University researchers have created a new map of the world which tracks basically every physical structure on Earth, from your home to a shed in Mongolia.
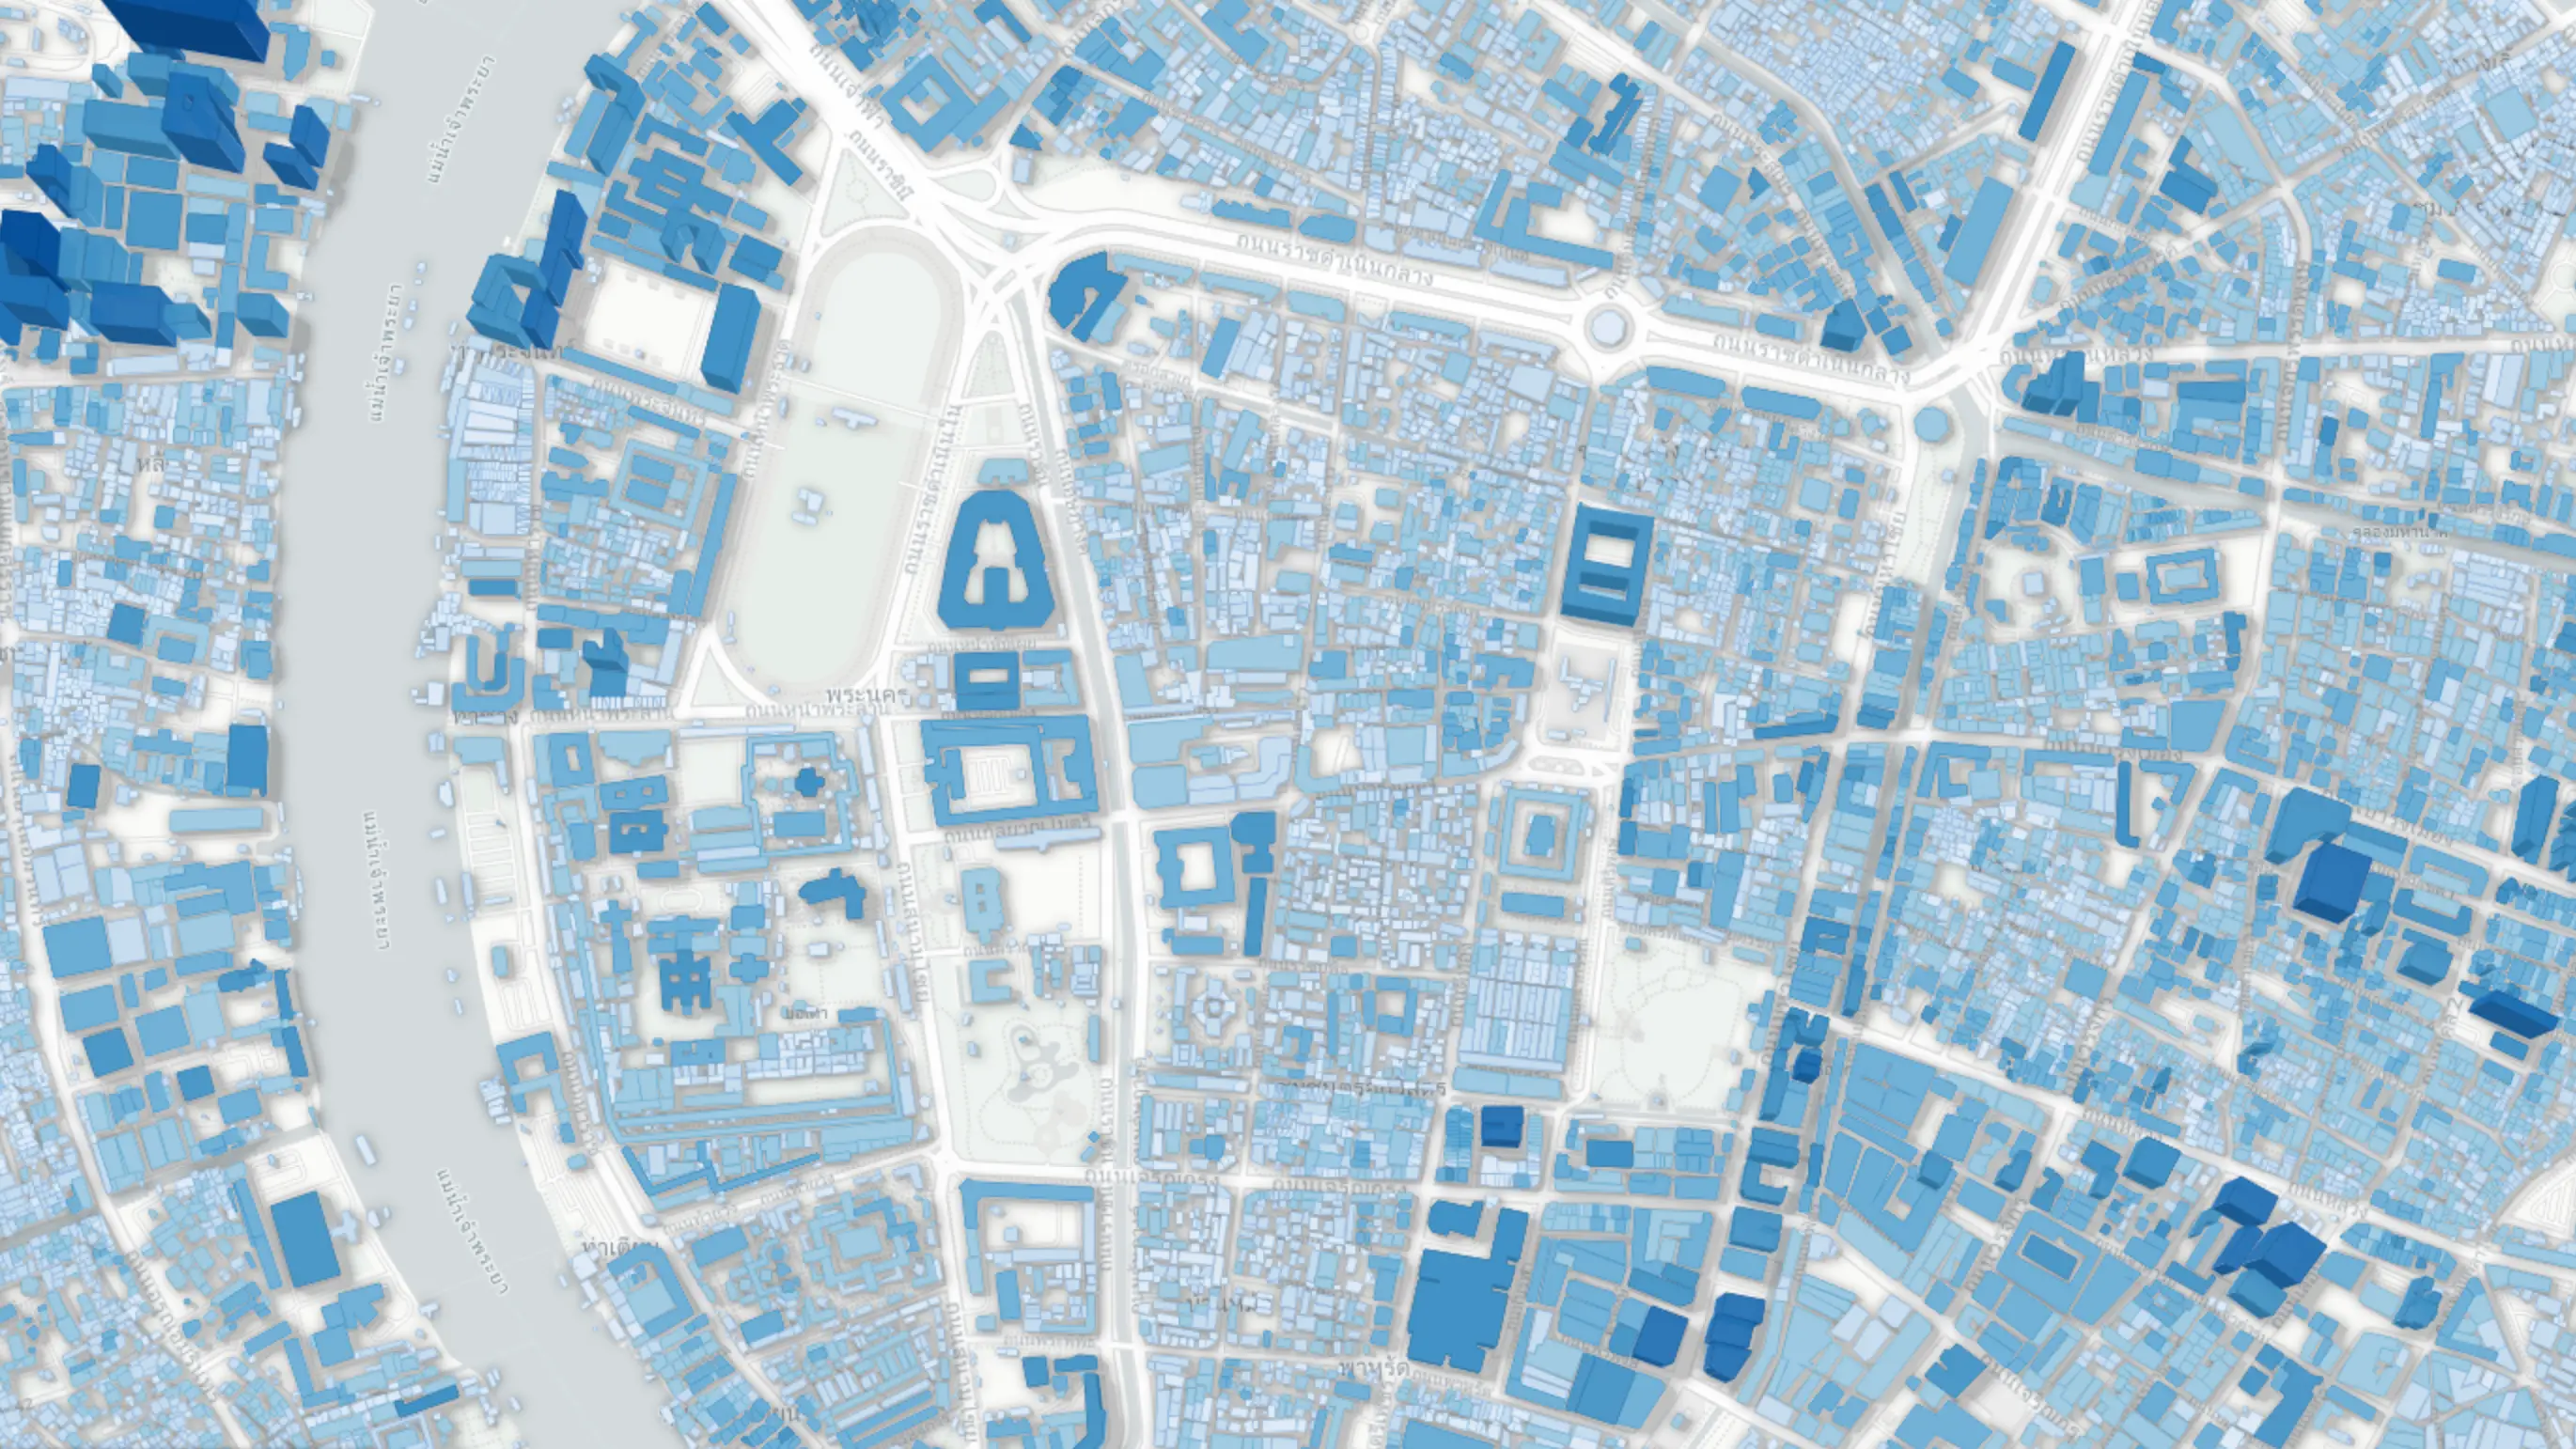
The high resolution map was created by scientists at the Technical University of Munich, who used AI machine learning tools to process over 2.75 billion buildings.
Combining more than 800,000 satellite images from 2019, the team of German scientists were able to track for the first time how humanity and its structures have changed the face of our planet.
Called the GlobalBuildingAtlas, the new tool contains a billion more buildings than any comparable dataset and has 30 times more detail than any other 3D model.
Advert
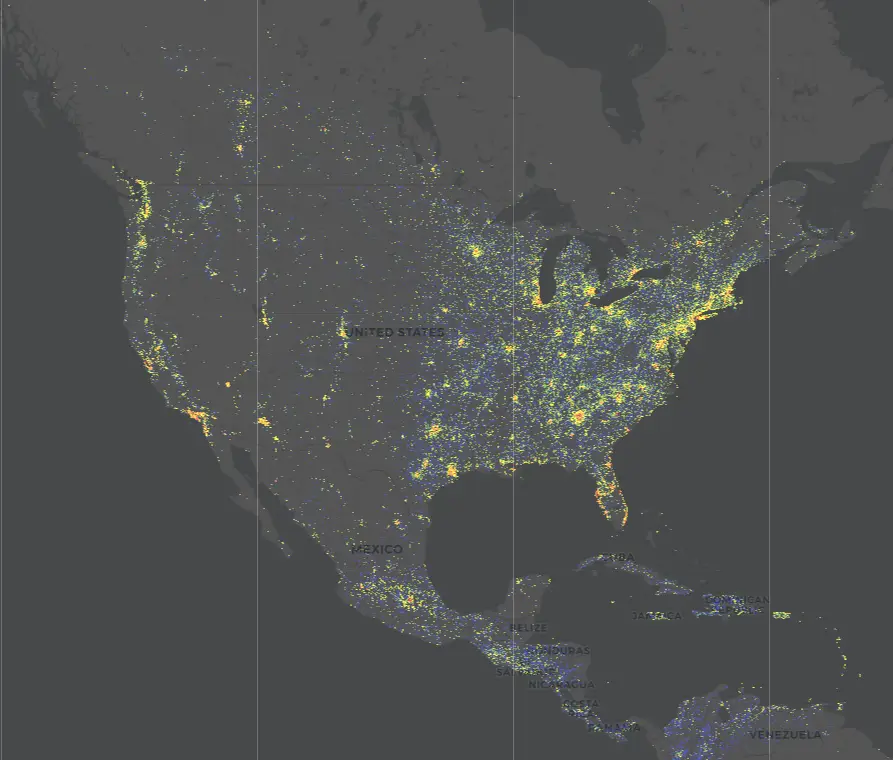
It is hoped that this information will help inform public policy, with the detailed map revealing a great deal about human geography, wealth inequality, and how we affect what remains of the world's last wild spaces.

"With 3D models, we see not only the footprint but also the volume of each building, enabling far more precise insights into living conditions," the lead author of the study and dataset project head Professor Xiaoxiang Zhu said.
The AI model estimates the height and volume of every building on Earth, as well as its distance from neighbouring properties. This applies to rural as well as urban areas.
The tool aims to provide future researchers with a plethora of population-level insights into housing density, inequality and climate change.
The map took years for the team to develop, with researchers combining vast mapping datasets and training their AI model to distinguish between the ground, buildings, and other non-structures such as trees and roads.
Part of its innovation is that it has created the incredibly accurate model from pre-existing satellite data and machine learning, without needing to fly expensive ground-scanning planes over an area.
"3D building information provides a much more accurate picture of urbanization and poverty than traditional 2D maps," Zhu explained.
This can even grant you insight into the wealth of an area, with wealthy areas tending to be more spacious and have more buildings per person than poorer areas.
The professor added: "With 3D models, we see not only the footprint but also the volume of each building, enabling far more precise insights into living conditions.
"We introduce a new global indicator: building volume per capita, the total building mass relative to population – a measure of housing and infrastructure that reveals social and economic disparities. This indicator supports sustainable urban development and helps cities become more inclusive and resilient."
The team hopes that governments will be able to use their comprehensive global map to better plan urban development, as well as when responding to natural disasters like floods and earthquakes.
In the days since its launch, the research team at the Technical University of Munich have seen more than almost 300,000 people visit their website to use the interactive buildings database.
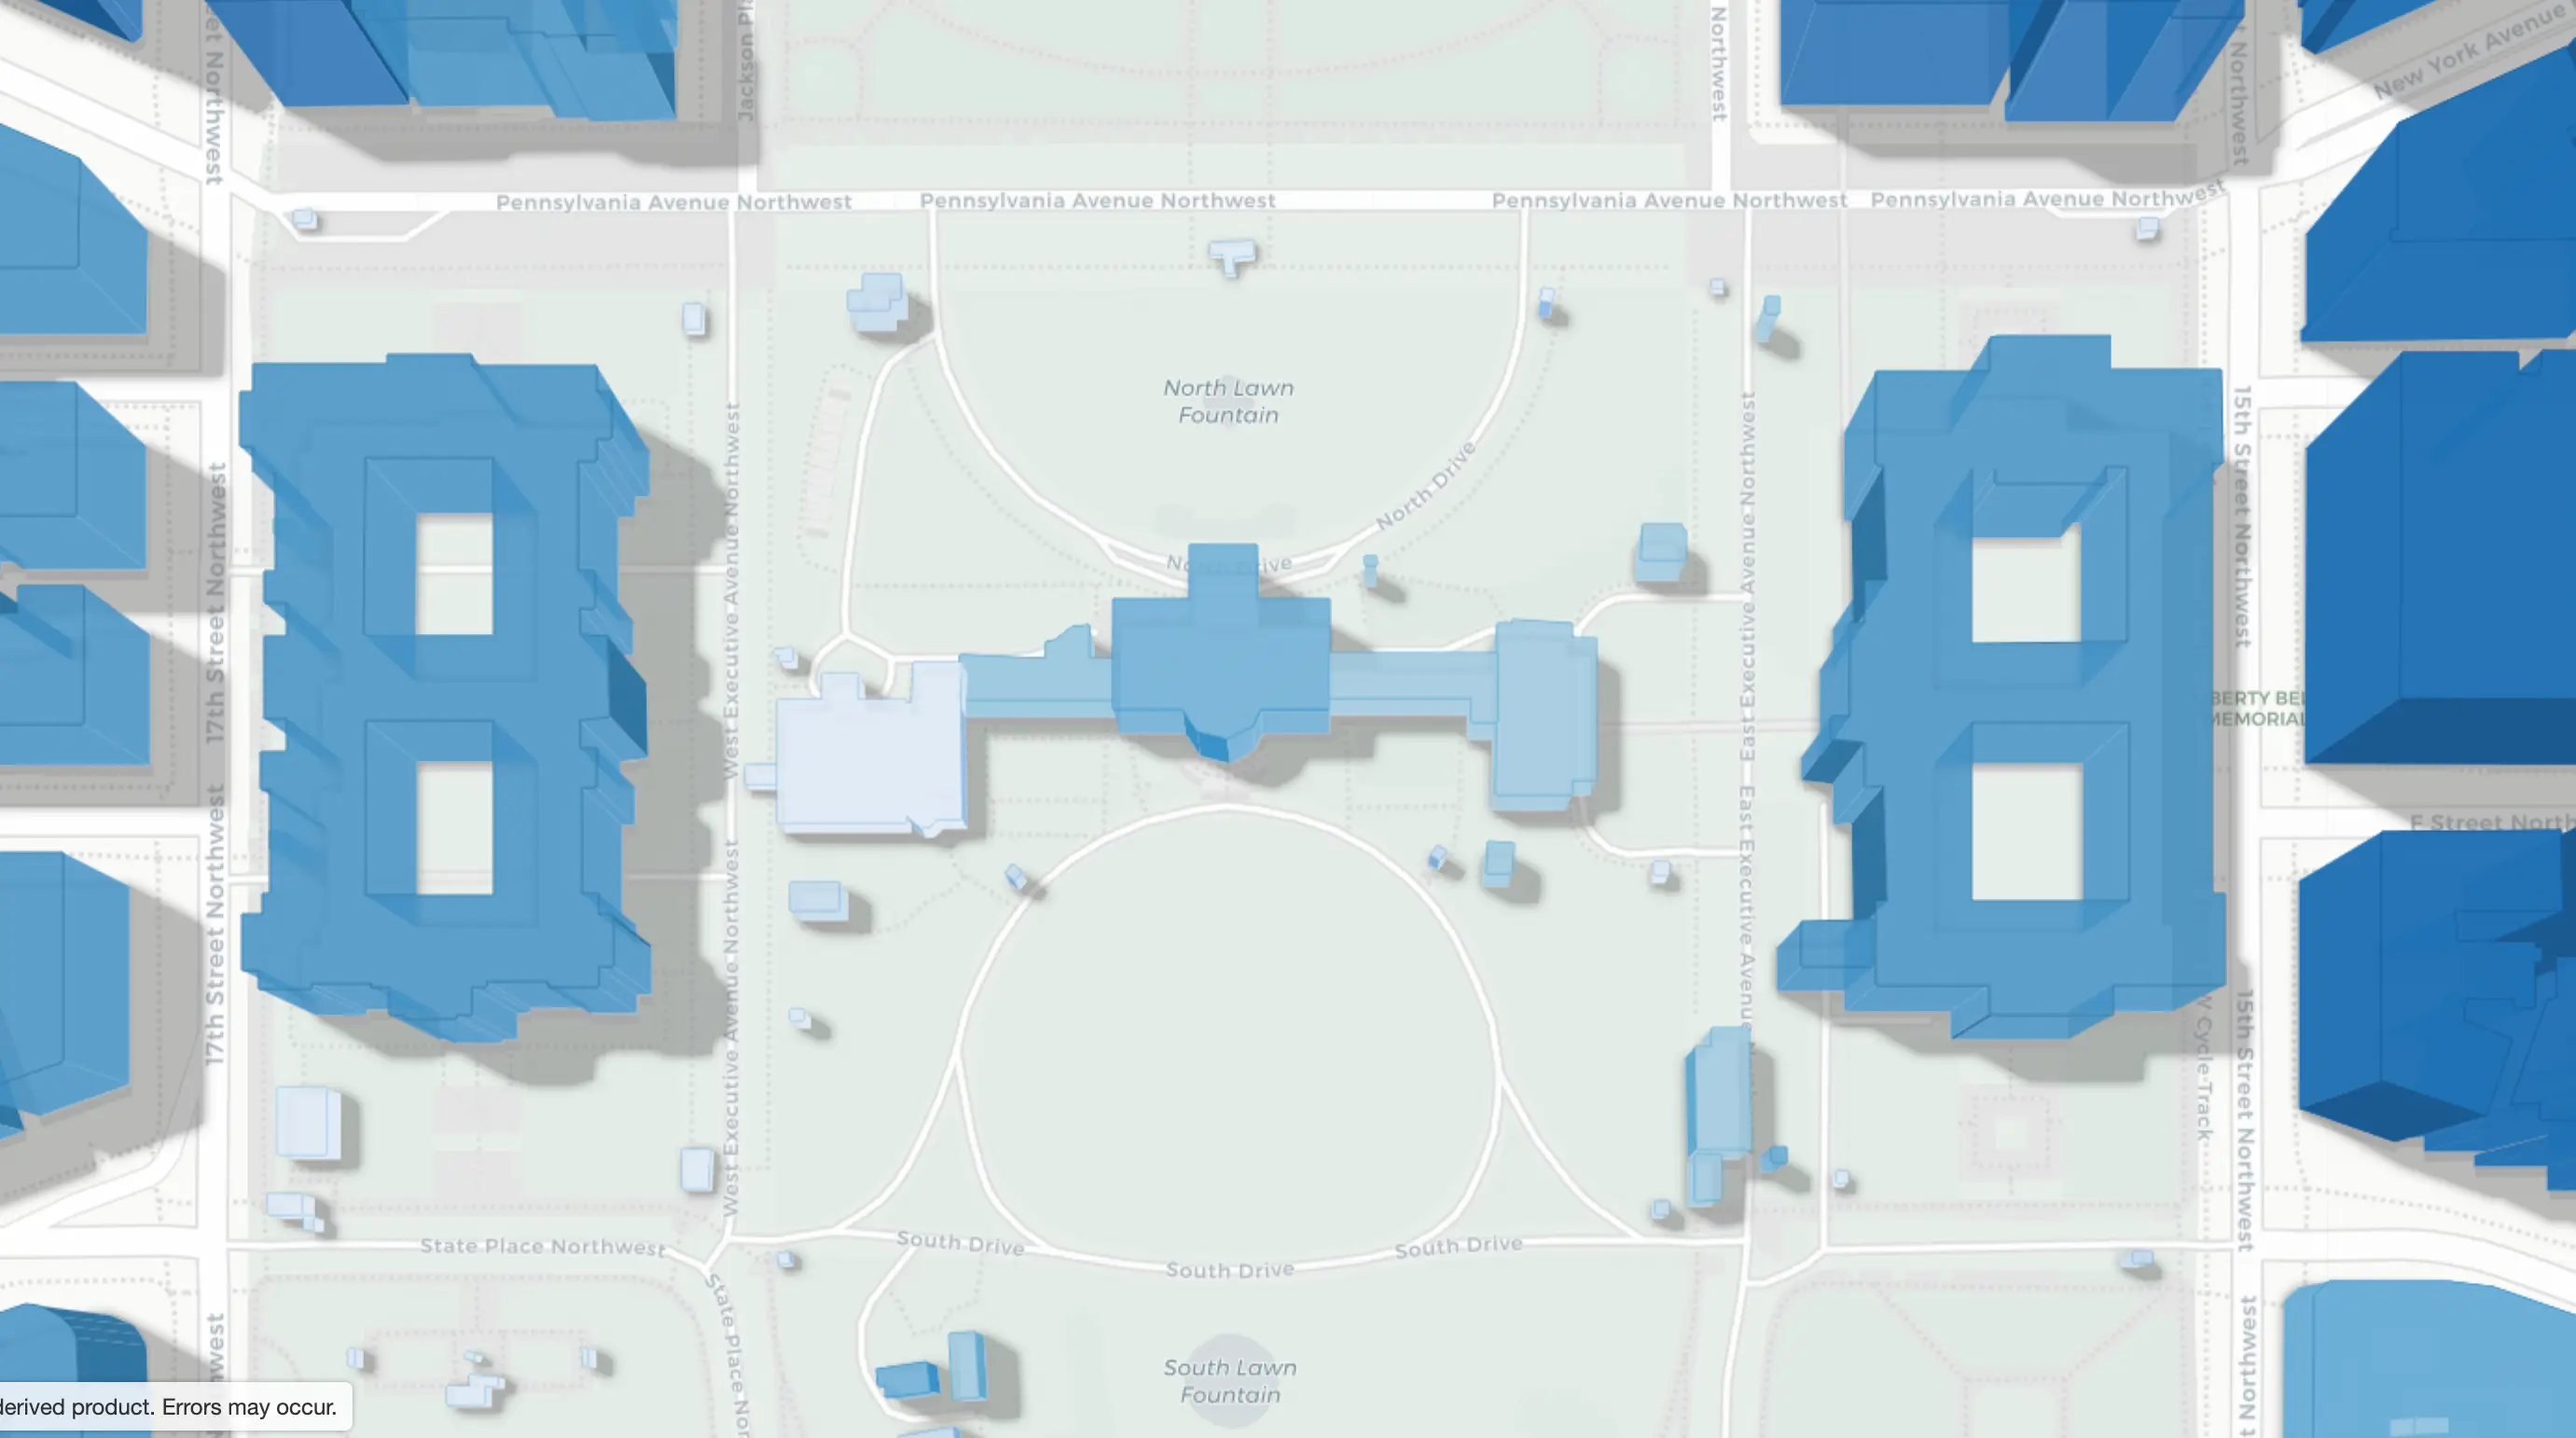
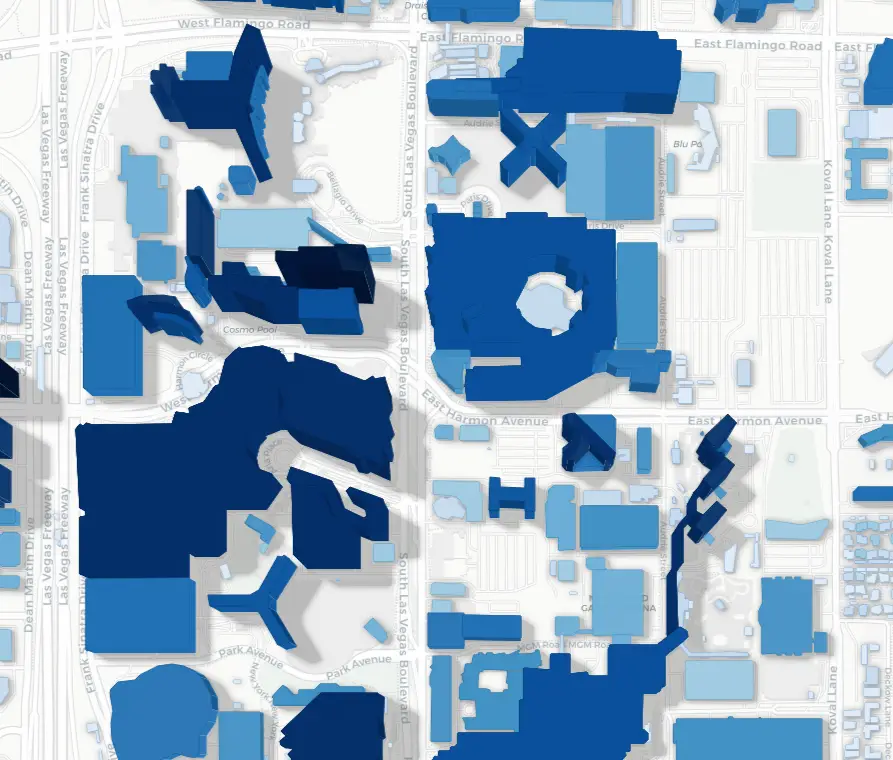
You can see the tool's 3D model of your home here.
Topics: Science, Climate Change, Google Maps
 William Morgan